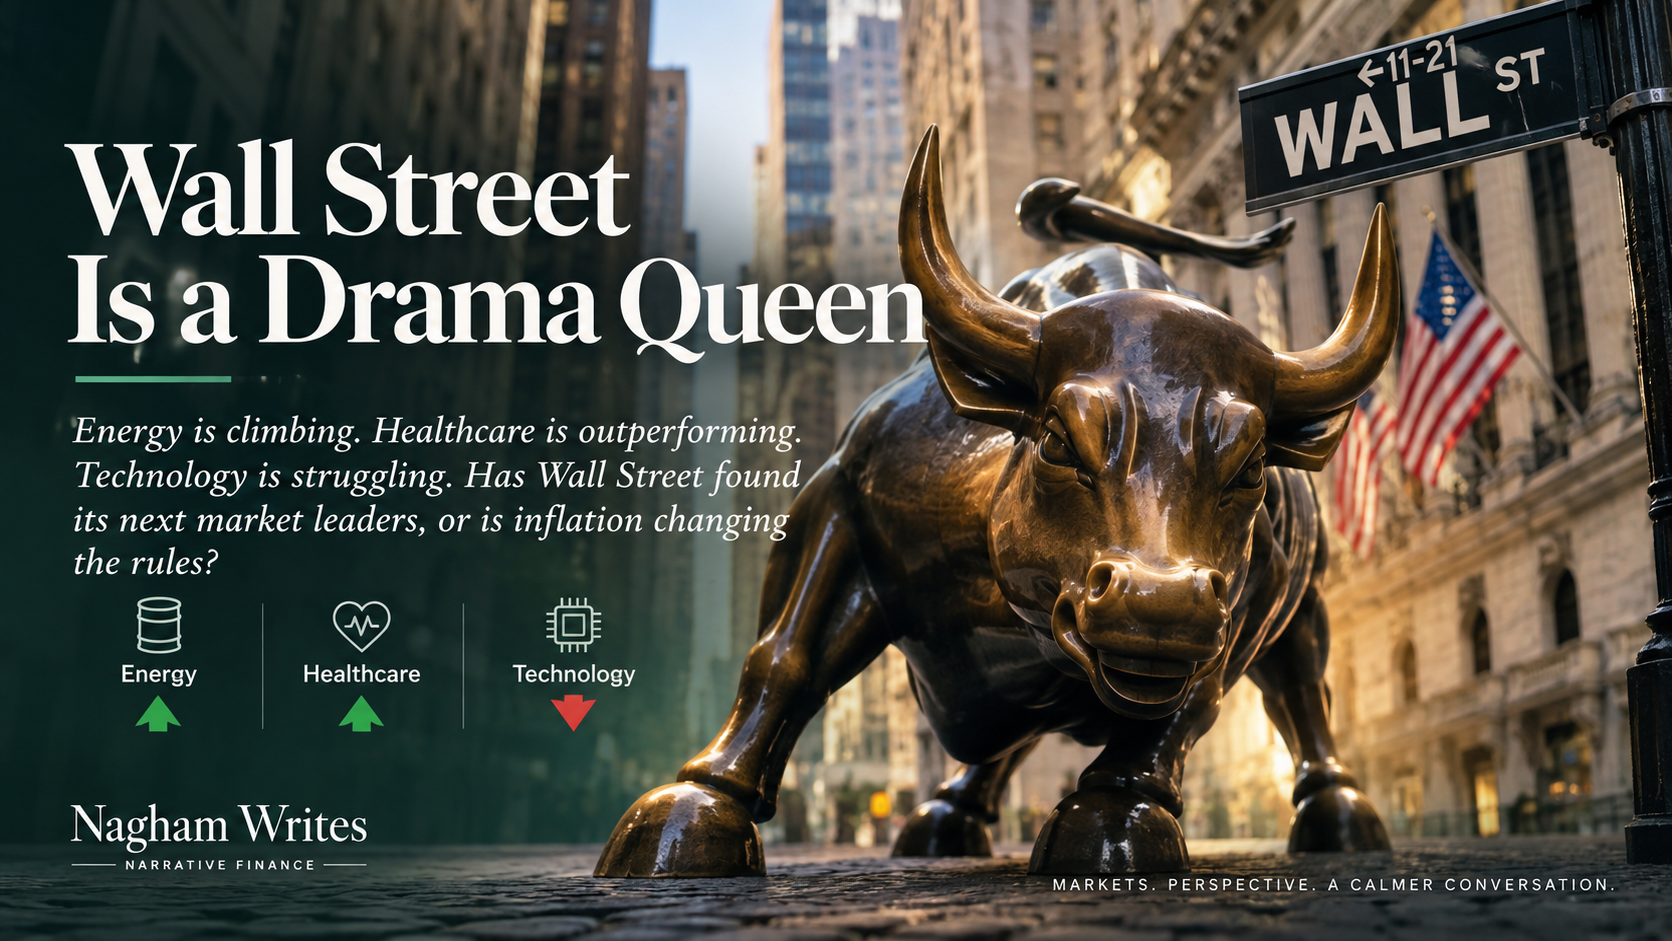
Wall Street Is a Drama Queen
Energy is climbing. Healthcare is outperforming. Technology is struggling. Has Wall Street found its next market leaders, or is inflation changing the rules?
Wall Street is a drama queen. That is what makes it fun, actually.
Everyone knows something you don’t know about the unforeseen future.
Some say, “Buy the dip!”
Hello? Nobody can consistently time the bottom, sweetheart.
Others seem ready to sell everything, buy a farm, and start milking cows. The American economy is apparently finished.
My favorite narrative, though, is that money is rotating.
As a Stoic, I prefer evidence to predictions. I cannot control what the market does tomorrow, but I can control how I interpret what it is telling me today.
So let us focus on what we know and leave Nostradamus resting peacefully in his grave.
Yalla! That means let’s go in Arabic.
Take notes.
What the numbers are telling us
Over the six trading sessions from the October 6 close to the October 14 close, three major sector ETFs delivered remarkably different results:
| Sector ETF | Price return |
|---|---|
| Energy Select Sector SPDR (XLE) | +6.1% |
| Health Care Select Sector SPDR (XLV) | +4.1% |
| Technology Select Sector SPDR (XLK) | −5.7% |
Source: ChartExchange historical closing prices for XLE, XLV, and XLK. Calculated price returns, excluding distributions.
Remember XLE and XLV? We discussed both in our first Sunday Letter, back in September, when we examined opportunities in a high-interest-rate environment.
Was I predicting a rotation? Absolutely not, sweetheart.
I was identifying conditions worth watching.
And now those conditions are giving us something interesting to investigate.
The technology ETF is heavily weighted toward large companies, so its decline doesn’t mean every technology stock fell equally.
Still, the pattern deserves attention.
Denial is an investor’s enemy. So is rushing to conclusions.
The divergence is real. The conclusion is less straightforward.
A few strong sessions in energy and healthcare do not establish a lasting transfer of market leadership.
To understand whether rotation is actually developing, we need to examine what is driving the moves, not merely which stocks are moving.
First, remember where we started
The S&P 500 was trading near record highs in early October.
On October 14, the index declined 1.1%, while the Nasdaq Composite lost approximately 1.9%. The Russell 2000, which tracks smaller U.S. companies, also fell nearly 2%.
These are meaningful declines. But context matters.
A pullback from elevated levels is different from a market already suffering a prolonged breakdown.
Technology and semiconductor stocks had also been showing weakness before the latest inflation report.
Investors were questioning valuations, the cost of financing enormous AI investments, and whether future profits would justify today’s expectations.
Inflation added another concern.
One inflation story, two reactions, and a wildcard
To understand the latest market moves, start with oil.
Higher oil prices can benefit energy producers. But they can also make gasoline more expensive, push consumer inflation higher, and raise expectations that interest rates will remain elevated.
Higher interest rates generally reduce the present value of profits expected far into the future.
The same rise in oil prices that supports energy producers can create pressures that hurt richly valued growth stocks.
September’s inflation report illustrates the mechanism.
Consumer prices rose 0.6% during the month, bringing annual inflation to 3.7%, up from 3.4% in August.
Gasoline prices increased 9.1% and accounted for more than half of the monthly rise in the headline index.
Core inflation, which excludes food and energy, reached 2.6% annually, up from 2.4% in August.
So energy was a major contributor, but inflationary pressure was not limited to energy.
The headline reading was only 0.1 percentage point above the 3.6% consensus estimate. That is a modest surprise, not an extraordinary shock.
Nevertheless, the 10-year Treasury yield briefly reached approximately 5.29% on October 14 before retreating to around 5.19% by the close.
That is why I would not blame the entire technology selloff on one inflation report.
The economic connection is plausible. But a plausible explanation is not the same as proof of causation.
Healthcare, meanwhile, presents a different question.
Sources: Bureau of Labor Statistics — September CPI; Barron’s — October 14 inflation reaction.
Healthcare is outperforming. Is that really rotation?
Between October 6 and October 14, XLV gained 4.1%, while XLK lost 5.7%.
That is a gap of nearly 10 percentage points.
And unlike energy, healthcare’s recent performance cannot be explained primarily by rising oil prices.
On October 14, RBC Capital Markets upgraded healthcare from market weight to overweight while downgrading technology from overweight to market weight.
Its reasoning was interesting.
Technology valuations had become less attractive following substantial gains. Fund inflows were weakening, although they had not turned negative, and earnings-estimate upgrades in parts of the semiconductor industry were slowing.
Healthcare, by comparison, offered more attractive valuations, improving fund flows, and a more favorable earnings-revision profile.
That gives the healthcare argument something beyond a rising stock chart.
But there is a complication.
UnitedHealth reported better-than-expected third-quarter earnings on October 13 and raised its full-year outlook. That provided a company-specific reason for investors to reassess the stock.
Not every healthcare company is a traditional defensive investment, either.
A fast-growing pharmaceutical company with a demanding valuation is different from a mature pharmaceutical manufacturer or a managed-care insurer.
And all of them face their own business and regulatory risks.
Healthcare’s relative strength deserves attention. But sector outperformance, an analyst upgrade, and several company-specific catalysts are not yet proof of a permanent rotation.
Sources: RBC sector strategy; UnitedHealth Q3 earnings.
AI is not dead. But the price of growth matters.
For years, the AI investment story has centered on extraordinary growth.
How many chips will companies need? How quickly can data centers expand? How much productivity can artificial intelligence create?
Those questions still matter.
But investors are beginning to ask another set:
- How much capital will this expansion require?
- How will companies finance it?
- When will that spending translate into sustainable free cash flow?
- How much of the expected success is already reflected in stock prices?
The last question may be the most important.
An excellent company can still be a disappointing investment if its share price already assumes an exceptional future.
With 10-year Treasury yields around 5%, investors have a meaningful alternative return available from government bonds. That raises the hurdle for expensive equities.
But we should not treat every AI company equally.
Some major technology businesses produce enormous amounts of cash and can finance expansion internally. Others depend much more heavily on borrowing or external capital.
Their vulnerability to expensive financing is not the same.
The AI revolution can continue even if some AI stocks have become too expensive.
Believing in a technology and paying a sensible price to invest in it are two different decisions.
The missing piece: Small caps
Here is another reason I hesitate to declare a broad market rotation.
The Russell 2000 fell nearly 2% on October 14, broadly matching the Nasdaq’s decline.
Smaller companies are often more sensitive to borrowing costs, refinancing risk, and changes in economic demand.
Their weakness matters because a broadly improving market should eventually show healthier participation beyond a handful of large companies.
Of course, rotation from technology into large-cap healthcare or energy does not require small caps to outperform.
But small-cap weakness makes it difficult to argue that the entire market is broadening.
A market can change its favorite sectors without becoming healthier overall.
What about gold and Bitcoin?
Now for two assets that complicate the story.
Gold is widely regarded as a hedge against monetary instability and inflation. Bitcoin is sometimes described as digital gold.
But their short-term behavior can be very different from those narratives.
On October 14, spot gold fell approximately 1.8%, with Reuters reporting a price near $4,084 per ounce during the session.
Why would gold fall during an inflation scare?
Because gold pays no interest. When investors expect higher interest rates and the dollar strengthens, holding gold can become less attractive in the short term.
The next day’s movement illustrates the point. On October 15, gold rebounded above $4,150 as the dollar weakened and yields eased.
Same asset. Different market conditions.
Bitcoin, meanwhile, was trading around $83,500 ahead of the October 14 inflation report, according to Investopedia.
Its volatility and sensitivity to liquidity conditions make it unreliable as a short-term safe-haven indicator. A fall in Bitcoin can reflect reduced risk appetite, leverage unwinding, or crypto-specific developments rather than a rotation between equity sectors.
Neither gold nor Bitcoin provides a clean answer to whether investors are rotating out of technology.
But both belong in the discussion because they remind us that sector rotation and broader risk reduction are not the same thing.
If investors become uncomfortable with expensive technology, they do not necessarily rush into gold, Bitcoin, or any single alternative asset.
Sometimes the market is simply repricing risk.
Sources: Reuters — Gold, October 14; Reuters — Gold rebound, October 15; Investopedia — October 14 briefing.
Five tests that could change my mind
I do not want to declare a new market regime because a few sectors had a good week.
Here is what I will monitor instead. These are practical indicators, not scientifically validated trading signals.
1. Sector leadership: Can the winners keep winning?
I will compare XLE and XLV with XLK and the broader S&P 500. If energy and healthcare maintain their relative strength over approximately 20 trading sessions, the case for sustained leadership becomes more persuasive.
2. Interest rates: What happens if yields fall?
If Treasury yields retreat and technology regains leadership, that would support the argument that higher rates contributed to its weakness. If yields fall but technology continues to lag while other sectors outperform, the rotation argument becomes stronger.
3. Market breadth: Is participation improving?
I will watch the number of advancing versus declining stocks and compare the equal-weight S&P 500 with the conventional, market-cap-weighted index. Broader participation would strengthen the case for a healthier change in leadership.
4. Earnings revisions: Are fundamentals supporting the move?
Higher stock prices are not enough. I want to see earnings estimates improving in the sectors taking the lead. A durable rotation should eventually be supported by business performance, not just market enthusiasm.
5. Fund flows: Are investors actually reallocating?
An analyst downgrade is one signal. Persistent changes in sector ETF and institutional fund flows would provide stronger confirmation. Changing sentiment can move prices quickly, while sustained capital allocation may help establish a longer-lasting trend.
When will I revisit the thesis?
November 13, 2026.
By then, I will reassess three essential conditions:
- Is relative sector leadership persisting?
- Is market participation broadening?
- Are earnings expectations and capital flows supporting the new leaders?
If all three show convincing progress, I will be more willing to describe the market as undergoing a broad rotation. If only energy and healthcare continue outperforming while most of the market struggles, I will call it selective sector leadership.
And if technology recovers when yields decline, the recent episode may look more like a valuation correction than a lasting change in leadership.
The idea is simple: establish the evidence before deciding on the conclusion.
What this means for investors
I would not rush to sell technology and buy whichever sector performed best last week.
That is not investing with a framework. That is chasing another narrative.
Instead, I would look at portfolio concentration, valuations, financing requirements, and the quality of corporate earnings.
For energy, the question is how much of the strength depends on oil prices staying elevated.
For healthcare, it is whether earnings and valuations justify the recent outperformance.
For technology, it is whether companies can turn extraordinary investment into sustainable cash flow.
And for gold and Bitcoin, it is whether they are serving the purpose investors actually expect them to serve.
I do not need to predict which sector will lead next month. I need to recognize when the evidence is strong enough to challenge my assumptions.
The question is no longer simply which companies can grow the fastest.
It is which companies can justify their prices when money costs 5%.
Market and ETF figures are based primarily on information available through October 14, 2026, with the October 15 gold update identified separately. ETF comparisons use closing-price returns and exclude distributions. This article is for educational and informational purposes only and does not constitute personalized financial advice.